Leaf Area Index
What is Leaf Area Index (LAI) and why do researchers interchange values with PAR?” LAI can be determined directly by taking a sample of foliage from a plant canopy, measuring the leaf area per sample plot and dividing it by the plot land surface area. LAI is used to predict photosynthetic primary production, evapotranspiration (evaporation and transpiration) and as a reference tool for crop growth.
“Primary production is the synthesis of organic compounds from atmospheric or aqueous carbon dioxide. It principally occurs through the process of photosynthesis, which uses light as its source of energy, but it also occurs through chemosynthesis, which uses the oxidation or reduction of chemical compounds as its source of energy. Almost all life on earth is directly or indirectly reliant on primary production. The organisms responsible for primary production are known as primary producers or autotrophs, and form the base of the food chain”.
As such, LAI plays an essential role in theoretical production ecology and Climate Change studies. The hard data cannot be overlooked especially at regional and local scale for improving the parameterization of the process in various classes of models. Systematic data acquisition from space sensors is thus crucial in the development of such well-documented information about the changes occurring in Earth’s biosphere.
Getting a value for leaf area index is often a variable along the way. If you plan to use LAI to model environmental interactions of the canopy, measuring photo-synthetically active radiation (PAR) may be a more direct route. That’s because many mathematical models use LAI to predict PAR in their internal equations. Sometimes researchers use PAR to predict LAI, and then surprisingly put the LAI number in a model that goes back the other way. You may want to evaluate whether LAI is the most useful parameter in your particular application.
It is sometimes more straightforward, and usually more accurate, to simply measure intercepted PAR and use that data directly in an appropriate model, especially when working with small gardening scales. It proves to be a useful tool in the quantification of environmental variables in greenhouse crops for different latitudes and ranges of planting densities and pruning. Commercial greenhouse productions are well controlled and production practices are often rather standardized which implies a general applicability for a photo-thermal model of leaf area index for greenhouse crops.
For instance, say that ‘canopy angle distribution parameter’ is “x”. It describes the architecture of a canopy -how its leaves are oriented in space. Leaves that are distributed randomly in space are said or explained to have a spherical distribution. This means that if each leaf in the canopy were carefully moved without changing the orientation, the leaves could be used to cover the surface of a sphere. A canopy with spherically distributed leaves has a χ value of 1.

Canopy of the Leaf
It is very easy to try to use an exact number for χ although it will only be accurate to a couple of decimal places. This kind of accuracy is impossible to attain because of the questionable variations in different plant life with regard to their respective vegetative growth and their canopies. Leaf area index numbers, though valuable, are always just approximations. A good χ value promotes the accuracy of the LAI approximation. But even with a less accurate χ value, Leaf Area Index are formulated using approximations and it is practical of being fair and accurate, depending on other variables and conditions like type of plant life.
Another example of where estimates must be used are if you decide to use PAR Value figures. Again, one must also consider that there are many variables which are inconsistent from one gardening area to another. One garden may have white painted walls, whereas another garden may be using mylar. Such variables and differences between the two materials will address different results and thus, different values.
For some, their indoor gardening experience has best provided consistency and optimal results when applying mylar to the surrounding area, or as a directional barrier. Mylar is a highly reflective polyester film that comes in varying thicknesses, the most common being 1mm and 2mm thick. It has higher reflectivity, approximately 95% and in some applications can be used to reflect light back up from the floor which has added value as opposed to most painted surfaces. So to say that one gardening area will have the same PAR value or leaf area index as another, isn’t exact based on materials used and plantations themselves.
Some people may have misconceptions and believe that using common mirrors would be a good idea when it comes to attempting to reflect light, but it is not. Most mirrors are poorly graded. For scientific use, the color, or wavelength of light, which the mirror will reflect must be considered. For standard visible light or ultra violet light mirrors, aluminum coatings are common. The mirror is to be used with infrared light, a silver or gold coating is best. Dielectric coatings are also good in the infrared range. Ultimately, however, the choice of coating depends on durability as well as wavelength range, and some reflectivity may be sacrificed for resilience. A dielectric coating, for example, is much more scratch resistant than a metallic coating and, despite the additional cost these coatings are often added on top of metal to protect it. Coatings on scientific grade mirrors are usually applied on the front surface of the glass, because light which travels through glass will always distort to a small degree. This is undesirable in most scientific applications.
The above paragraphs on reflectivity are merely thought-joggers in the midst of calculation and estimation.
To approximate an χ value for a canopy, you must find a representative clump of canopy which is of equal depth and width. Then determine vertical gap fraction the percentage of light to shade you see vertically through the clump, and the horizontal gap fraction the percentage of light you see horizontally through the clump.
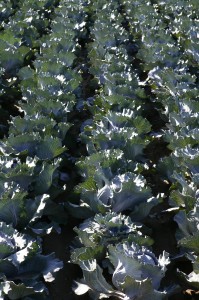
Row Crops-Cabbage
Out of practicality, it can be difficult to estimate the amount of light that is visible through a “representative clump” of the canopy. You may find it easier to make a backdrop and use it to help you analyse the canopy, many people use a one meter by one meter square of coloured poster board. Find a clump reasonably typical of the canopy you are studying. The clump should include all the typical elements of the canopy.
If you are studying row crops the clump should go from the centre of one row to the centre of the next to include the characteristic gap in the canopy that occurs between rows. When using LEDs as primary lighting the effects of time of day isn’t as significant of a factor because the light source tends to remain at a constant for your crops, whereas when making measurements outside with natural light, light consists of many variables given the different times of day and measurements of canopy light interception.
Check your reasoning of your estimation by remembering that the χ values for more horizontal canopies are greater than one while those of more vertical canopies are less than one.
References:


Leave a Reply
Want to join the discussion?Feel free to contribute!